Understanding Clouds from Satellite Imagery: A Deep Neural Network Approach
1. Background
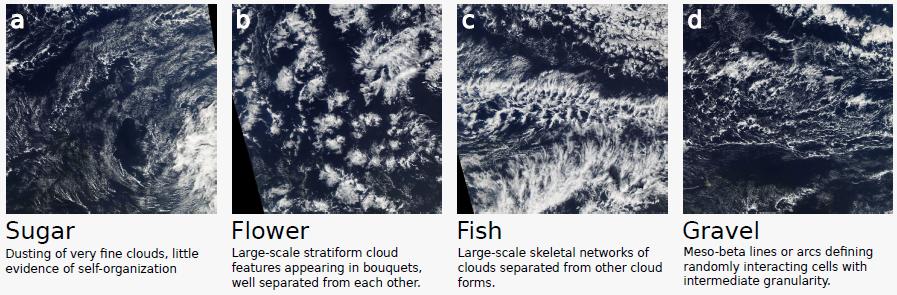
Mesoscale organization of shallow clouds is a challenging topic in the studies of clouds and climate. It is frequently observed in satellite imagery but not yet well understood in the research community. Scientists have come up with four common categories of mesoscale organizations: Flower, Fish, Sugar and Gravel. For a full description of the characteristics of each group, you are referred to [1]. In figure 1, several samples are presented to illustrate the difference among the four categories.
 |
|---|
| Figure 1. Examples of the four different patterns found in shallow clouds organizations |
As labeling such patterns requires a large amount of time and efforts by scientists and researchers, in this project we are moving a step forward to see if a deep learning algorithm is able to generalize the knowledge in clouds organization and identify those patterns correctly and robustly. This research will guide the development of next-generation climate models with less uncertainty in clouds. If successful, we can help scientists to better understand how clouds will shape our future climate.
This challenge is formalized as Kaggle data science competition (reference [2]). In this article, I will go through a solution and share some thoughts from there.
2. Data Description
The training dataset consists of 22184/4 = 5546 satellite images (provided by the Kaggle competition; also available from NASA Worldview) covering three regions, spanning 21 degrees longitude and 14 degrees latitude. The true-color images were taken from two polar-orbiting satellites, TERRA and AQUA, each of which pass a specific region once a day.
The labels were created in a crowd-sourcing activity at the Max-Planck-Institite for Meteorology in Hamburg, Germany, and the Laboratoire de météorologie dynamique in Paris, France ([1]). A team of 68 scientists identified areas of cloud patterns in each image, and each images was labeled by approximately 3 different scientists. Ground truth was determined by the union of the areas marked by all labelers for that image, after removing any black band area from the areas.
 |
|---|
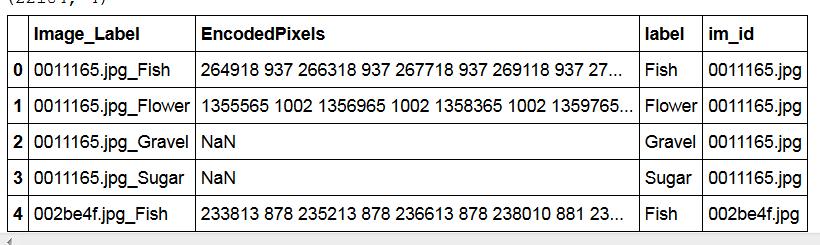
| Table 1. An example of data labels (flower, fish, sugar, or gravel) and the corresponding masks (RLE encoded). Note that multiple labels could co-exist in one image. |
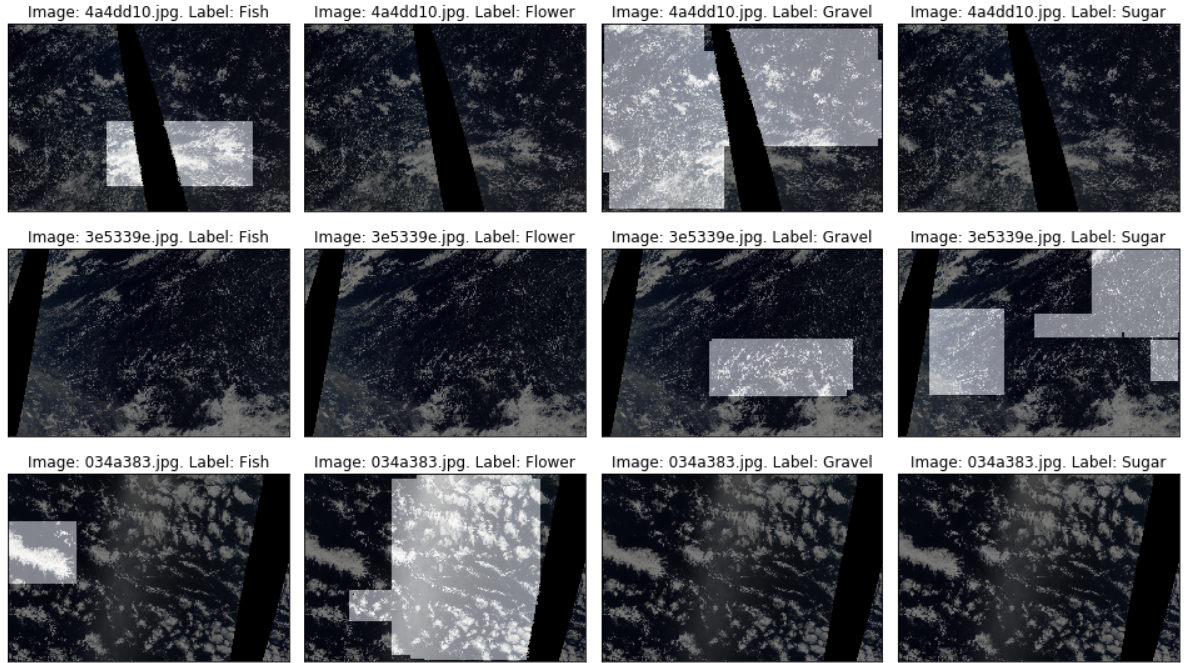
Four randomly selected four images in the training dataset are presented in the figure below. It should be pointed out that n image might be stitched together from two orbits (due to the small footprint of the imager (MODIS) on board these satellites). The remaining area, which has not been covered by two succeeding orbits, is marked black.
 |
|---|
| Figure 2. Randomly selected four images in the training dataset. |
The task of the competition is to develop machine learning algorithms that can generate similar masks (for the four classes: flower, fish, sugar and gravel) and deploy such algorithms to identify the cloud organization type for each given satellite image.
3. Methodology
There are various computer vision techniques out there, and the first step towards a successful solution is to define the learning problem and find proper techniques that can potentially solve this category of problems.
3.1. Image segmentation vs. object detection
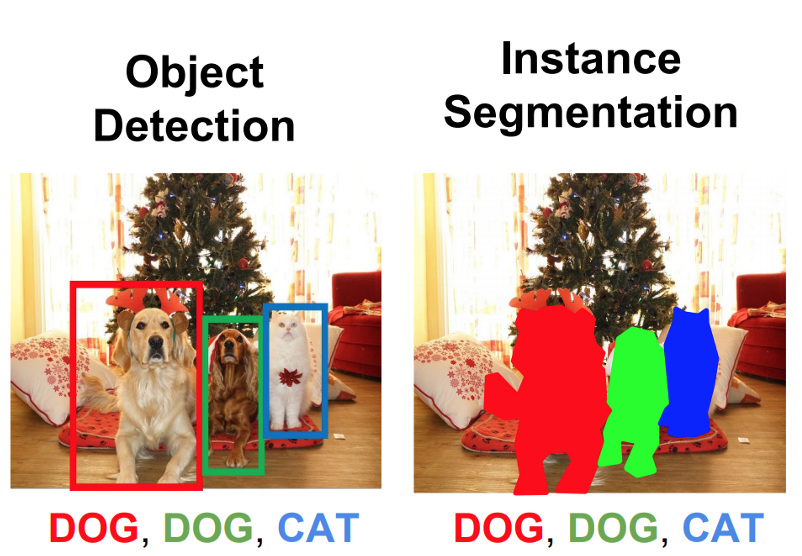
From the labeling examples we have seen (figure 3), we were asked to generate masks for each type of cloud organization in more or less regular shapes. This reminds me of classical object detection algorithms (such as SSD) in self-driving car where we need to mark out cars, buildings and pedestrians in each image in rectangles. However, the competition host pointed out that the rectangles we see in the examples (labeled images) are more for the convenience of scientists to draw the area manually and it is desirable to have algorithms that mark out the exact pixels which correspond to the specific type of cloud. Therefore, it is more useful if we can solve the problem as a semantic segmentation task other than object detection.
Both object detection and semantic segmentation are common subjects in computer vision. Object detection aims to identify whether any of the candidates classes exist in an image and what are their locations, usually represented as a rectangular window, if they do exist. On the other hand, semantic segmentation can be understood as a pixel-level classification, where we are trying to classify what contents (for example, whether it is a dog, a cat or just background, etc) each pixel belongs to. Two examples are shown below to illustrate the difference between object detection and semantic segmentation.
 |
|---|
| Figure 3. An illustration of object detection and image segmentation |
3.2. U-Net: A fully Convolutional neural network (CNN) for segmentation
In this project, I used U-Net as the basic network structure for the segmentation task. U-Net is a fully-convolutional deep neural network initially designed for biomedical image segmentation ([3]). It has been shown to outperforms many sliding-window based CNN models and gain popularity for segmentation problem in various applications. The U-Net features a U-shape two branch architecture. On the downward branch, the input images is scaled down through a sequence of convolution operations; on the upward branch, the result was brought back to its original scale after de-convolutions. One cool feature of U-Net is the links that connects convolution layers (in the downward branch) and deconvolution layers (in the upward branch). They serve as “information bridges” to bring the large-scale image context back to the segmentation model after zooming into very fine details.
 |
|---|
| Figure 4. The network structure of U-Net |
3.3. Residual deep neural network (RESNET)
The basic U-Net structure can be further enriched by utilizing other networks in the two branches. In this project, residual deep neural network (RESNET) was applied as it showed good performance when the network becomes deep while many previous structures suffer training difficulties.
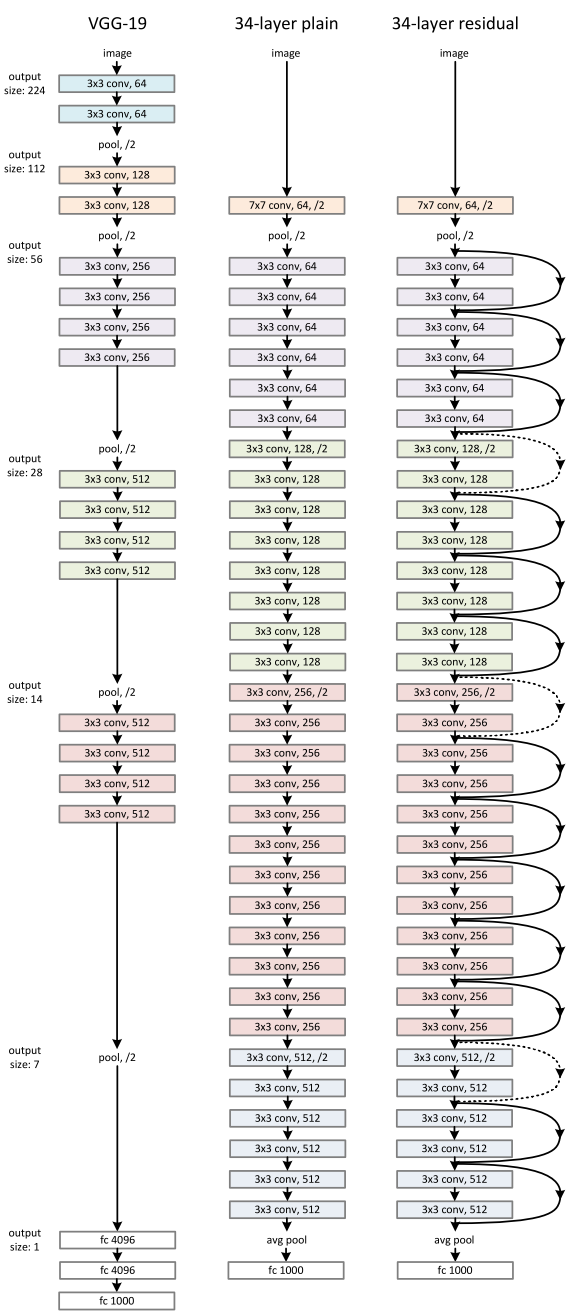 |
|---|
| Figure 4. RESNET |
Summmary
The model was built upon some high-level neural network libraries, and finally I achieved a Dice coefficient of 0.643.
Through this project, I got a first-hand feeling of how to build a neural network model to solve practical problem. Before training the model, I trained myself to learn some basic idea of the state of the art in this field (for example, existing models for segmentation) and equipped myself with necessary skills (like cloud computing on google platform). I was able to fulfill the task using some existing libraries and tools, and that is a very happy achievement.
However, I also felt a lot of pain when trying to dig into the code to optimize the model structure. One reason is that the model is developed based on some high-level libraries and I don’t get enough exposure to designing the code structure or implementing the details. As a next step, I am going to take a “from-scratch” approach to rebuild the model and I will talk about the implementation details in another article.
REFERENCES
[1] Rasp et al., "Combining crowd-sourcing and deep learning to explore the meso-scale organization of shallow convection", available at: https://arxiv.org/abs/1906.01906
[2] Kaggle competition: Understand Clouds from Satellite Images, available at https://www.kaggle.com/c/understanding_cloud_organization/overview.
[3] Ronneberger, et al., “U-Net: Convolutional Networks for Biomedical Image Segmentation”, available at https://arxiv.org/abs/1505.04597.
[4] He, et al., “Deep Residual Learning for Image Recognition”, available at https://arxiv.org/abs/1512.03385